Skip to content
Go to home page
What We Do
Work
About
News
Agencies
Careers
Contact Us
Contact Us
Industry News
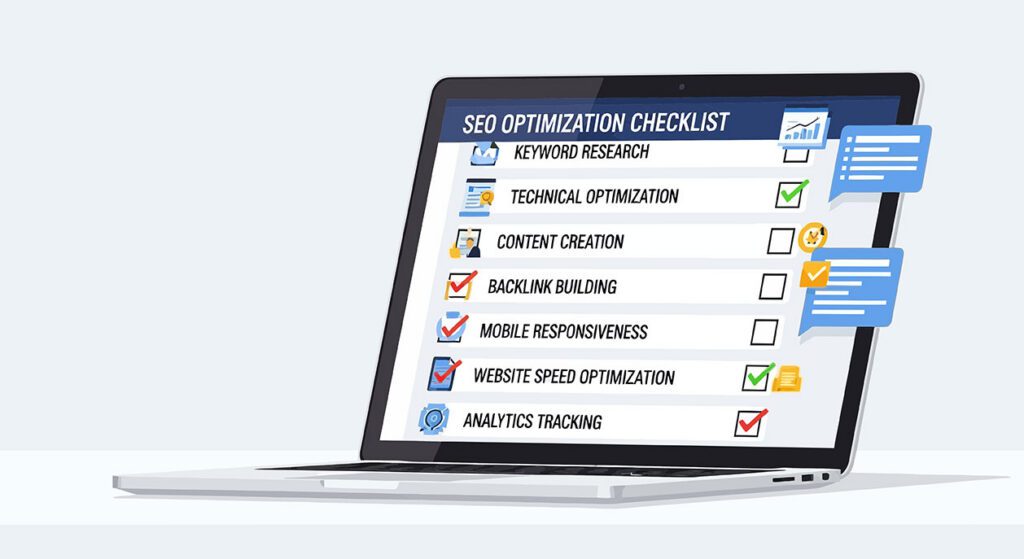
Technical SEO Checklist for 2026: What Actually Matters
By Cloudmellow
Posted: May 19, 2026
Read More
Search Industry News
Search
All Categories
AI
Checklist
Content Strategy
Digital Marketing
Marketing Trends
SaaS marketing
SEO
Web Performance
Website Development
All Tags
2024 Marketing Trends
Account Based Marketing
Ad Copy and Design
Ad Tracking Restrictions
AI-Powered Content Creation
Audience Targeting
b2b healthcare marketing
b2b saas marketing
Boosts SEO Rankings
campaign performance
Comprehensive Marketing Strategy
Content Marketing
Content Marketing with UX
Content Strategy
Conversion Funnel Optimization
Conversion Rate Optimization
Core Web Vitals
CTA Optimization
custom web design
Customer Data Privacy
Data-Driven Adjustments
Data-Driven Marketing
Data-Driven Results with Analytics
digital marketing
Digital marketing for Financial Institutions
Digital Marketing Innovations
Digital Marketing Strategies
E-commerce Strategies
Effective Marketing Strategies
Expert SEO Strategies
healthcare digital marketing
healthcare marketing
healthcare marketing strategy
healthcare marketing trends
Inbound Marketing
Inbound Marketing for Software
Inbound Marketing for Software Development Firms
inbound marketing strategies
Indexing
keyword research
Lead Generation Strategies
Local SEO
Local SEO for Real Estate
local seo marketing
local seo optimization
local seo services
Online Privacy Regulations
privacy regulations in healthcare
professional PPC management services
Professional Web Design Agency
ROI Measurement
saas go to market strategy
saas marketing
saas marketing metrics
saas marketing strategies
saas marketing strategy
Sales Techniques
search engine optimization
SEO Strategy
tailored PPC strategy
Telehealth Services
User Experience
UX Impact on Digital Marketing Success
visitor to lead conversion rate
Web Hosting Company
Website Conversion Tactics
Technical SEO Checklist for 2026: What Actually Matters
By Cloudmellow
Posted: May 19, 2026
Checklist
Digital Marketing
SEO
Web Performance
Core Web Vitals
Indexing
SEO Strategy
Read More
How to Build an AI-Ready Content Strategy That Converts
By Cloudmellow
Posted: May 5, 2026
Edited: May 19, 2026
AI
Content Strategy
Digital Marketing
AI-Powered Content Creation
Content Strategy
Read More
Hiring a Digital Marketing Agency: What To Expect
By Cloudmellow
Posted: April 15, 2026
Edited: April 16, 2026
Read More
How Google AI Search Impacts Content & Rankings
By Cloudmellow
Posted: April 6, 2026
Edited: April 15, 2026
Read More
Marketing Automation Workflows Every B2B Company Should Be Using
By Cloudmellow
Posted: February 26, 2026
Edited: April 16, 2026
Read More
Why Content Clusters Matter for Ranking In Google’s AI Search Era
By Cloudmellow
Posted: February 6, 2026
Edited: March 25, 2026
Read More
Multi-Location Business Marketing in the Age of AI and Automation
By Cloudmellow
Posted: October 28, 2025
Edited: November 5, 2025
Read More
LLM SEO Explained: Making Your Content Discoverable by AI Search Engines
By Cloudmellow
Posted: October 14, 2025
Edited: November 5, 2025
Read More
Why Your Business Website Probably Needs a Redesign – Advice From a Top Dallas Digital Marketing Agency
By Digital CloudMellow
Posted: September 29, 2025
Edited: February 2, 2026
Read More
1
2
3
…
5
→
Be BOLD &
Stand OUT